Welcome to the weekly Ouroboros Flows and Positioning Chartbook, a weekly compendium dedicated to providing a balanced view of the most noteworthy Flows and Positioning charts. None of the following is financial advice.
In this issue, we highlight 27 charts. Not much has changed in the charts since our first issue. We refresh them and find most telling the same story (a cautionary tale). A notable addition in this issue is global Funding Rates. We observed that the recent alt rally has driven funding rates to a level yet to be seen since the start of 2021. The 2 year high in funding rates adds to our cautious tilt, which consequently compels us to take positioning even lower, from net long to flat. While we were cautious in our first issue, we acknowledged the likelihood for one more leg to the rally esp in alts (which has played out), and therefore were still long then. However, the additional data point provided by funding rates suggests a need to increase caution, which we express in our flat positioning.
Separately, we continue to be bullish ETH over BTC into 2024 with several charts supporting the view. We see the narrative shifting to an ETH ETF as we head into 2024 and are already seeing signs of prepositioning from the charts (ETH spot to futures volume and ETH CME OI).
Global liquidity has been bottoming out, which has been supporting the recent rally in crypto (in addition to the ETF narrative). While we are near term cautious, this chart compels us to bullish into 2024.
In the past year, 20ish days is typically how long it takes for a near-term top after an aggressive up move. This suggests mid-Nov this time which we believe has started to play out.
Alt coin market cap is at post-LUNA/pre-FTX highs. We think its due for a retracement.
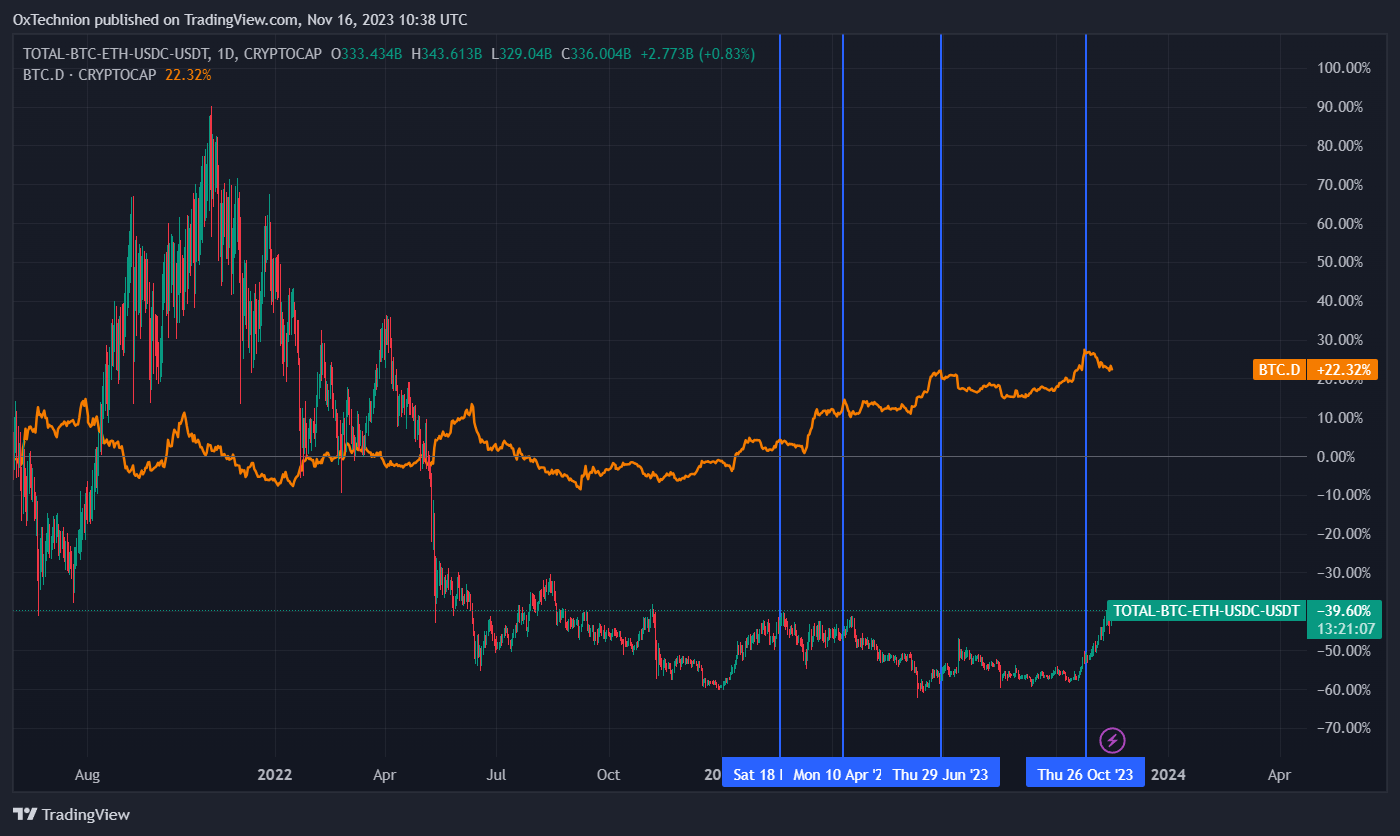
Total crypto market cap top of past 1 year range, due for a retracement.
BTC.D broke highs but retracing currently, seems to have peaked. There’s a tendency in recent times for the market to peak shortly after BTC.D has peaked.
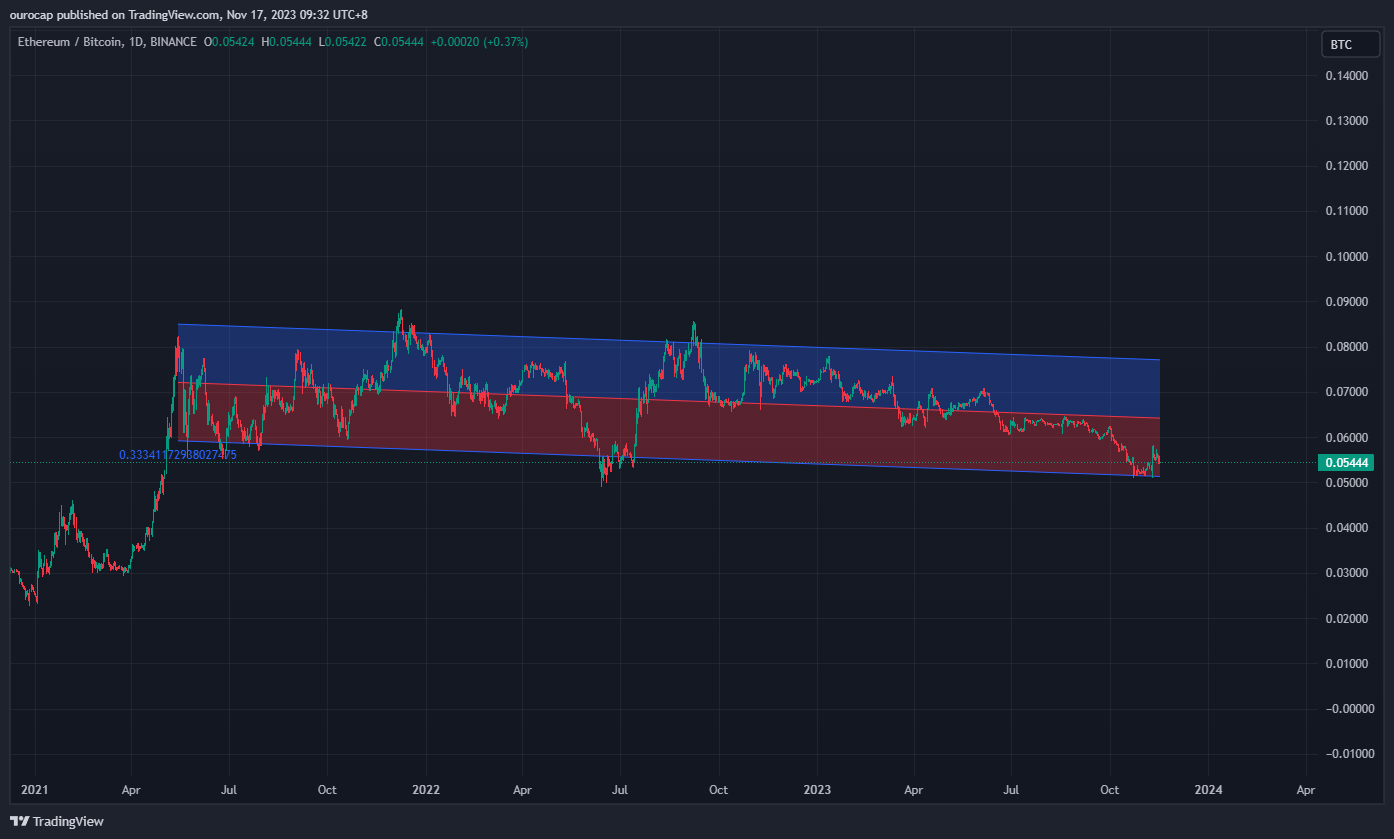
ETHBTC is bouncing off its range due to the narrative shifting towards an ETH ETF. The ratio is still at the lower end of its range which points to this trade still being in its infancy. One of the key points supporting our longer term bullishness for 2024.
BTC perp. More shorts have been squeezed out during this test of the highs, but we have yet to see an aggressive long liquidation. Spec long positioning is still heavy (suggested by funding as well).
ETH perp. Short squeeze isn't as aggressive in ETH but similar to BTC, it hasn't seen a clearing out of longs.
Alts OI up $1bn after the flush down. OI almost back to prior levels. Spec longs keep jumping back in. Reinforces our point that spec long positioning is heavy.
Global aggregated funding rates suggests that speculation is close to its excesses.
BTC 7D Trailing Average Exchange Netflows. Spot sends to exchange is starting to climb. Notice how when it accelerates, you get aggressive selloffs.
ETH 7D Trailing Average Exchange Netflows. Different picture from BTC. Quiet and can even be argued to be outflows (ie spot accumulation).
BTC CME vs Perps. TradFi positioning continues to be heavy. +$1.5bn OI in CME since mid October. Another sign of heavy spec long positioning.
ETH CME vs Perps. Significant increase in ETH CME OI almost double the past week from $322m to $607m. Market is now positioning for ETH ETFs. Still early days, we think this has legs.
Real spot bid in BTC continues to persist. Partially supports the mid to longer term bullish argument around allocation from real money coming back.
ETH spot bid continues to climb aggressively supporting the view that investors are starting to position themselves for the ETH ETF narrative.
BTC 1M IV - RV spread at +10.74. Options still expensive.
BTC 25-delta skew at the lows. Options are expensive due to upside speculation. Another early signpost of excessive bullishness.
ETH 1M IV-RV at +9.96. Options relatively more expensive now with IV higher.
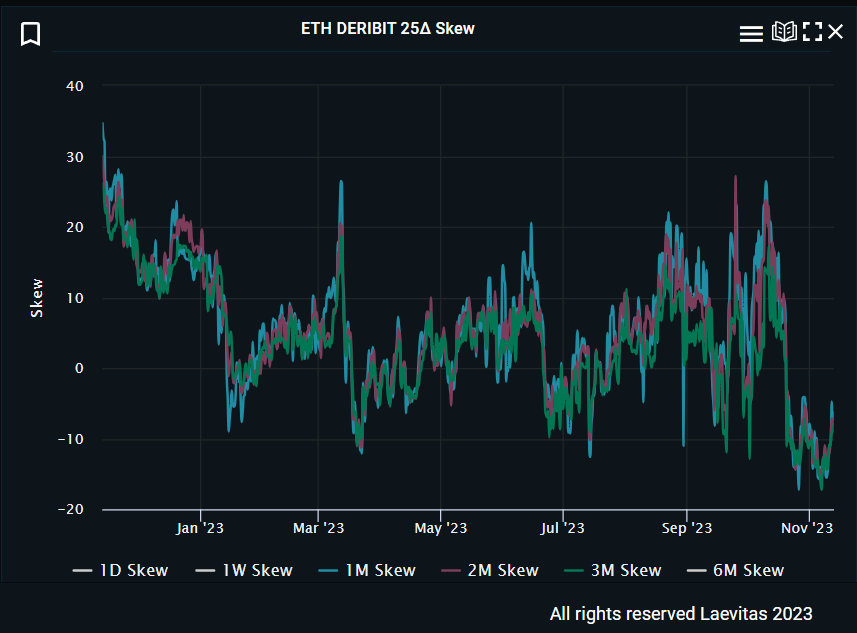
ETH 25-delta skew bounced off the lows still at the lower end of the range. Similar to BTC, options are expensive due to upside speculation.
Kingfisher BTC liquidation map. Liquidation cluster is now on the downside (~$34,500). Bearish.
Kingfisher ETH liquidation map. Similar to BTC, liquidation cluster is now on the downside (~$1,850). Bearish.
BTC STH NUPL. NUPL indicates the total amount of profit/loss in coins represented as a ratio. STH NUPL is approaching 2021 highs. Approach with caution.
High level of deployment from stablecoins to risk. Stablecoin market cap as a % of total crypto market cap is at the lows. This tends to herald retracements.
Miner net position change = 30D change of the supply held in miner addresses. Miners not selling (yet).
Alt L1s are pumping but are they really seeing increased activity?
Cosmos Ecosystem is one to watch. CosmosHub seeing a drastic increase in DAU and daily transactions in the past 7D. Possibly due to $TIA, $NTRN, etc.