Welcome to the weekly Ouroboros Flows and Positioning Chartbook, a weekly compendium dedicated to providing a balanced view of the most noteworthy Flows and Positioning charts. None of the following is financial advice.
The most notable event since our last issue was the Binance/DOJ headline, which puts us at a tricky crossroad. While we acknowledge the news as bullish and the clearing of a significant overhang, we aren't convinced that the market was already pre-positioned for the news. BTC price was close to its YTD highs and had a retracement of less than 10% at the time of the headline. Its difficult to call this a "clearing event". At the same time, the heavy positioning which we've been highlighting in the past 2 weeks (BTC and ETH CME OI) has yet to resolve which leaves us preferring to stay flat in the meantime.
Additionally, BTC miners recent selling adds further to our caution. We've seen in the past year that it tends to coincide with heavy retracements.
Incremental observations this week:
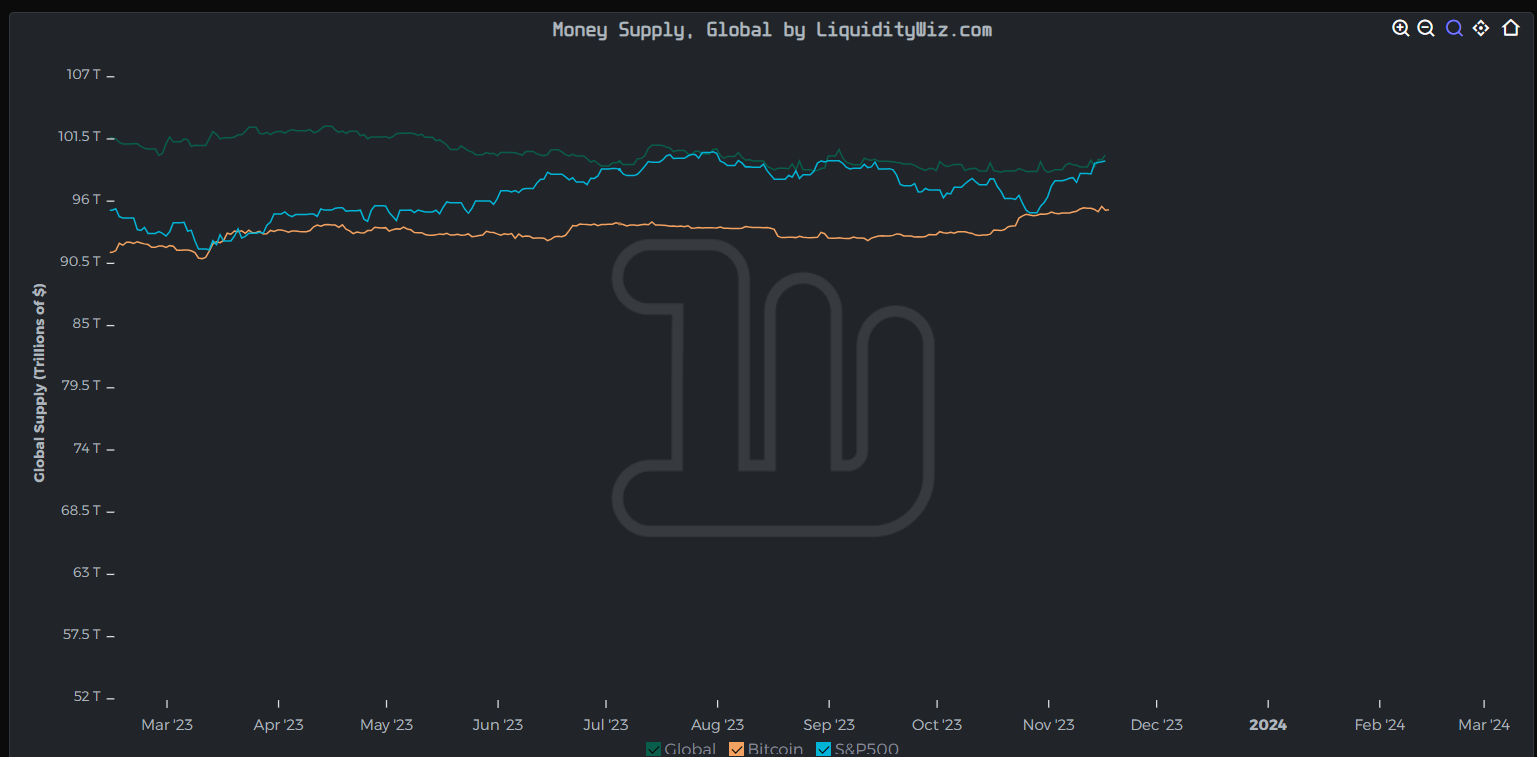
Liquidity - Stablecoin market cap is up $3b this past week since 12 Nov - Global liquidity seeing a small uptick this past week
OI and Funding - Global alts OI decreased drastically after last week’s OI buildup - Funding is also less positive since last week
Options - ETH options IV-RV is now negative at -0.98
Flows - BTC miners turn sellers
BTC miners are starting to turn sellers. This sometimes (not always) mark near term tops.
While we are near term cautious, bottoming global liquidity supports our longer term bullishness into 2024.
Small uptick in global liquidity past couple of weeks.
Total crypto market cap appears to be stalling as it hits the top of its 1 year channel.
Alt coin market cap is at post-LUNA/pre-FTX highs. We think its due for a retracement.
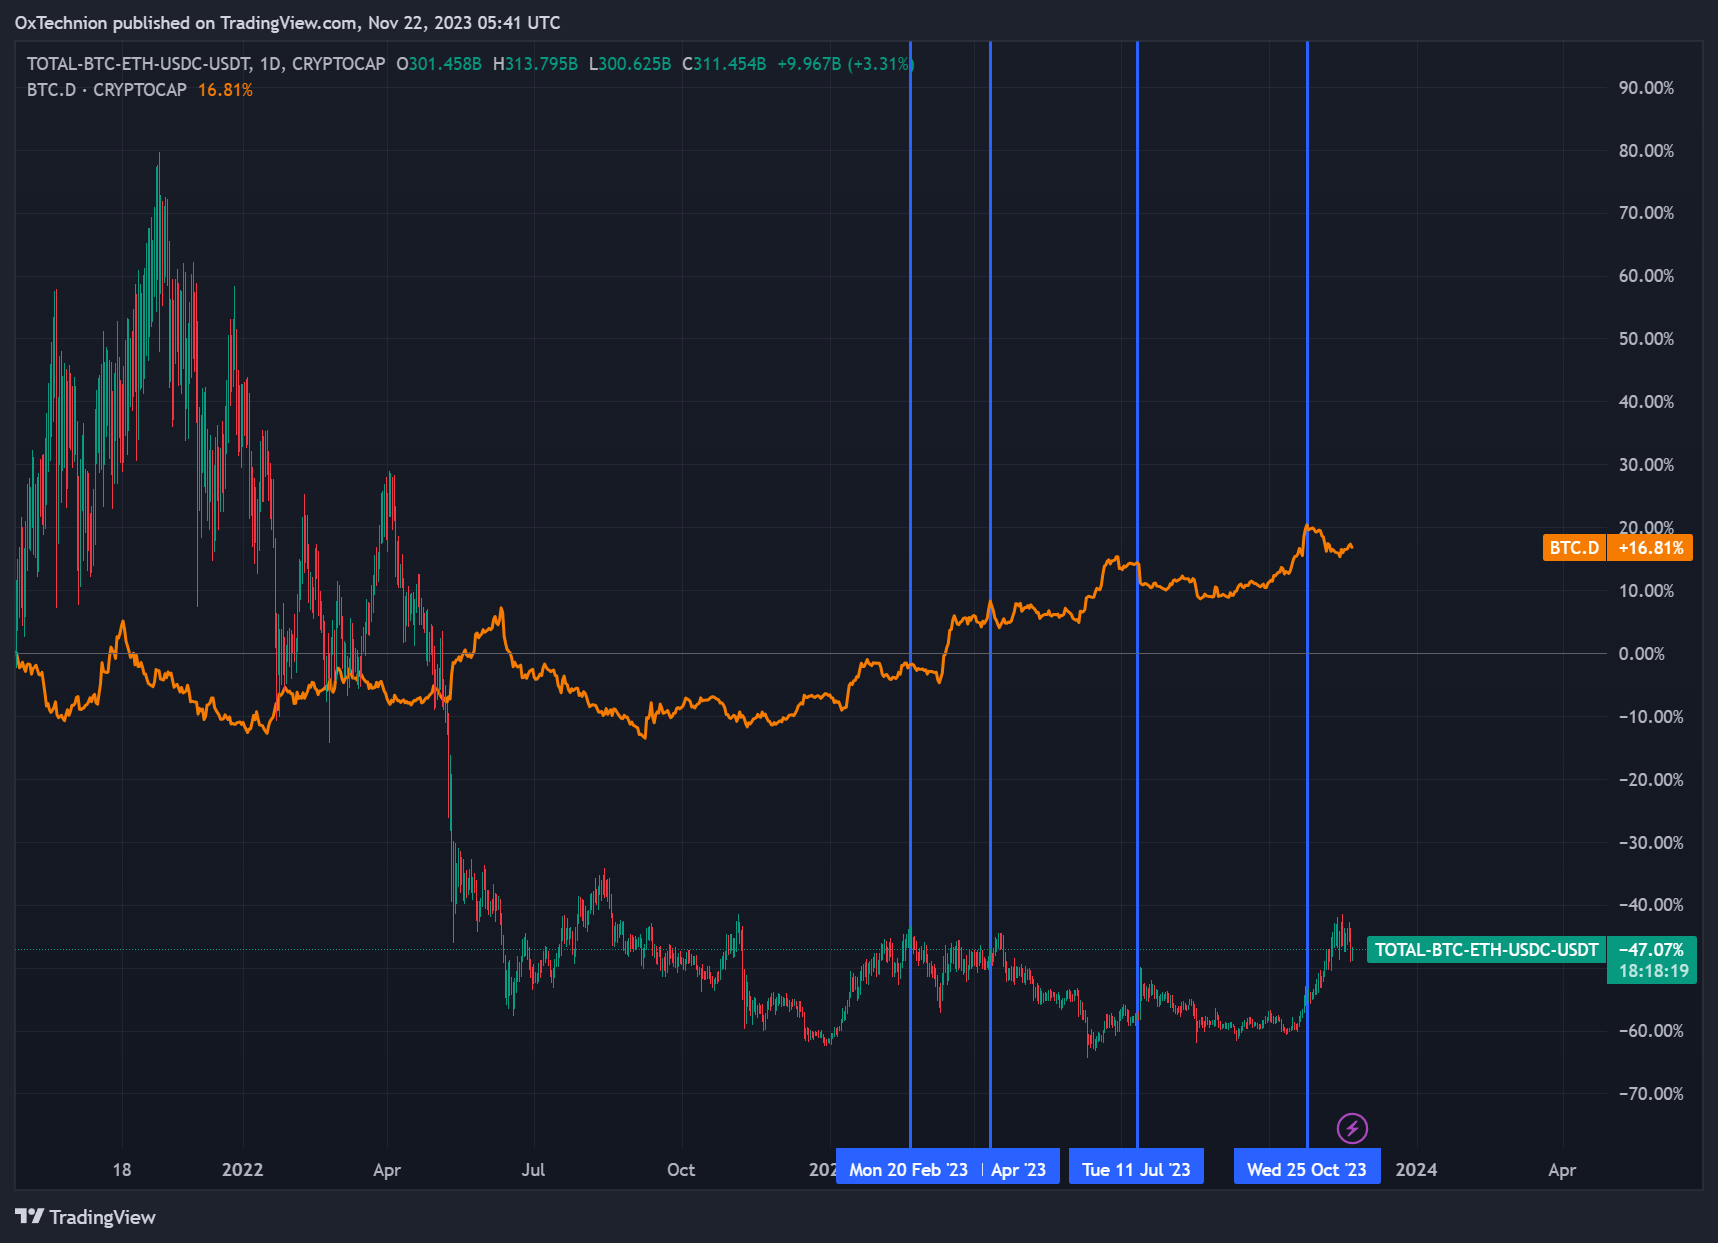
BTC.D broke highs but retracing currently, seems to have peaked. There’s a tendency in recent times for the market to peak shortly after BTC.D has peaked.
ETH approaching the upper end of its range as markets position for the ETH ETF.
ETHBTC price action has been lackluster, causes one to think if ETH positioning is too consensus.
BTC funding rates are cooling off after the recent long liquidations.
Similarly in ETH, funding rates are cooling off.
Significant reduction in alts OI over the past week. OI almost back to month lows.
Past 7D BTC spot flow to exchanges, seeing some slight inflows into exchanges but nothing too dramatic.
Past 7D ETH spot flow to exchanges, very quiet.
TradFi still bag holding into the BTC ETF. We think these are weak hands and likely the first sellers on the news.
Despite ETH's ETH narrative being fresher, TradFi doesn't seem as enthused. Perhaps due to ETH's lackluster price action.
BTC IV - RV spread at +4.2. Decreased since past weeks but due to a combination of both IV ticking down and RV ticking up.
BTC 25-delta skew near the lows. Options are expensive due to upside speculation. Another early signpost of excessive bullishness.
ETH IV - RV spread at -0.98. Mostly due to ETH RV ticking up.
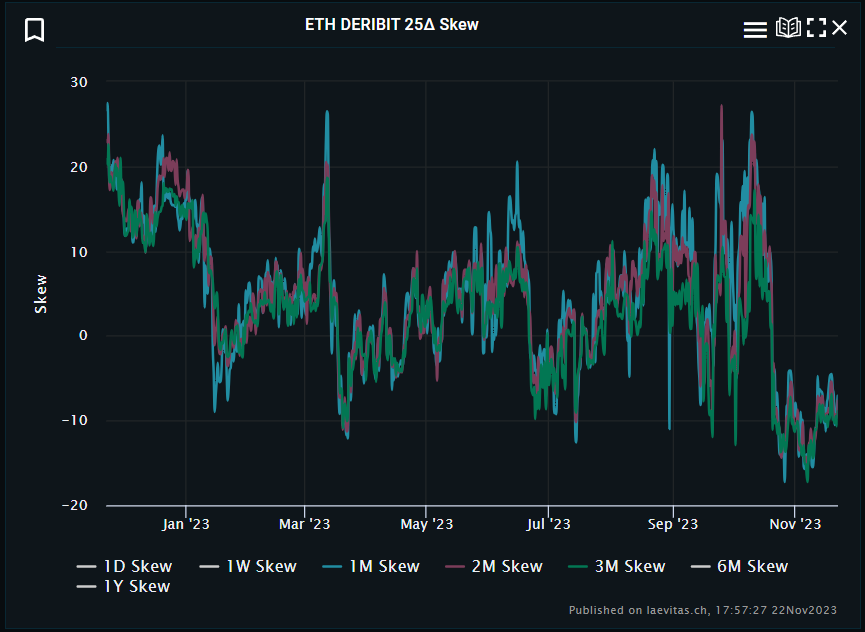
ETH 25-delta skew bounced off the lows but still negative. Options are expensive due to upside speculation. Puts are cheaper.
Kingfisher BTC liquidation map. Liquidation cluster is now further on the downside around 28K and 31K, no immediate near-term liquidation concerns.
Most of ETH liquidation clusters to the downside, quite evenly distributed.
BTC NUPL indicates the total amount of profit/loss in all the coins represented as a ratio. NUPL surpassing reaching previous highs. Can be inferred as either 1) this rally is driven by a real underlying catalyst (spot ETF) and/or 2) the rally being due for a pullback.
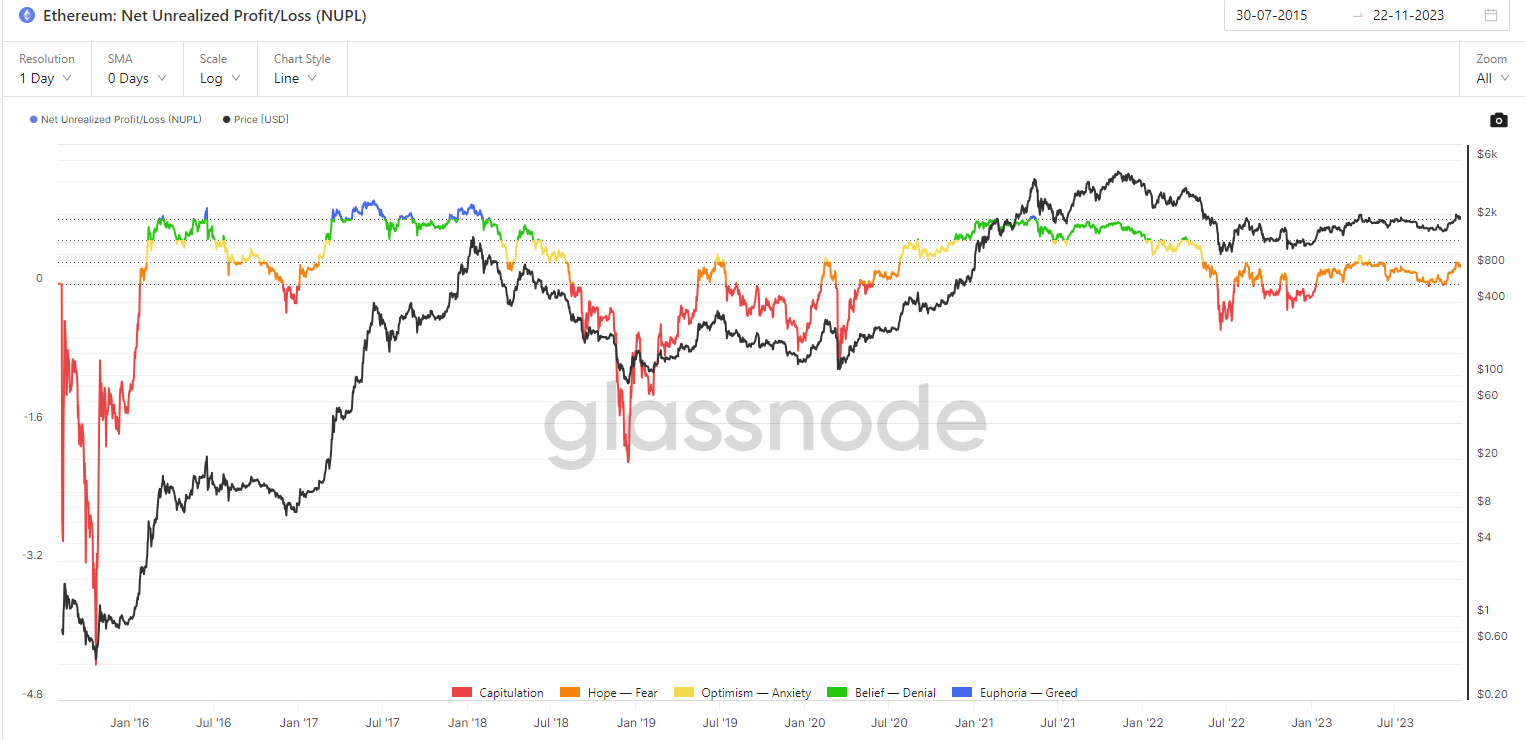
Similar picture for ETH NUPL.
High level of deployment from stablecoins to risk. Stablecoin market cap as a % of total crypto market cap is at the lows. This tends to herald retracements.
Stablecoin dominance is now at 8.5%.
Current stablecoin market cap around $118b, up $3b since last week 12 Nov.